Teaching and transformation in a pandemic year

Ajay Limaye playing trombone to a class over Zoom

The end of the academic year is a time of transitions. But this year, with cautious optimism that the US is emerging from more than a year defined by the pandemic, the sense of transition is profound. To some, this time presents a singular opportunity to reimagine our lives and replace tired routines from pre-pandemic life with something better. As I look forward to fall, a new question looms on the horizon: Which routines will I bring back to the classroom, and which ones will I leave behind?

I taught one class in person before the pandemic when I started as a professor at the University of Virginia in 2019. Pulling out a blank sheet of paper to compose lecture notes each morning, my mental state was best described as how can I possibly fill the 5 hours of class every week for 15 weeks? Needless to say, the task was daunting and exhausting.

I taught my next three classes in our alternate reality online. But surprisingly, my former teaching anxiety sublimated into a sense of opportunity. I know, I know; it sounds like I’ve been locked in my house a bit too long. The agony of Zoom is well documented. But this agony, the mental and emotional cost of time spent online, was a blessing in disguise. Zoom fatigue laid bare that it’s not the time spent in class that matters, it’s how we use it. Without purpose, inspiration and fun, the time spent in any class can feel like a form of imprisonment, regardless of the format.

Zoom made me feel the pain of meetings without meaning. Thankfully, my colleague Lauren Simkins nudged me toward a more purposeful path. Her advice: less is more. For example, keep lectures under 30 minutes, no matter what. 

This simple advice reframed my subconscious approach to teaching from filling space to centering meaning. By letting go of the need to fill the class time and instead forcing myself to make intentional choices about what to cover, I almost immediately found myself crafting more focused lectures. As these focused lectures took shape, I began to see a story arc emerge for the semester. For my intro geology class, what might have been a months-long slog through mineral names and stratigraphic principles was overtaken by the story of the Earth.  From one small change, I started to see the forest for the trees.

Shenandoah National Park, April 2021.

In teaching online, I also realized that the medium is the message. By considering the cost of Zoom time, I worked to minimize it as much as possible. I recorded the lectures so that any class meetings in real-time were for the explicit purpose of interacting: me with students and students with each other. I required office hours, meeting in small groups with all 110 students in my 3 classes. Full-class meetings centered on active learning in group activities, like using geoscience to understand the earthquake risk to a nuclear power plant near Charlottesville. The need for contact and ease of virtual connections inspired me to arrange class visits from colleagues near and far, from planetary astronomers Ilse Cleeves and Ann Verbiscer here at UVA to paleoclimate scientist Schmitty Thompson and planetary imagineer Mike Wong across the continent.

Whittling down the content to essentials also opened up room for fun. I used a movie crawl to introduce my planetary science class…

…and a trombone solo to end it.

The students improvised on this looser vibe in hilariously insightful ways. Wrote one student on the final exam: “Geology is not simply about sorting rocks, breaking geodes, and eating dirt.” 

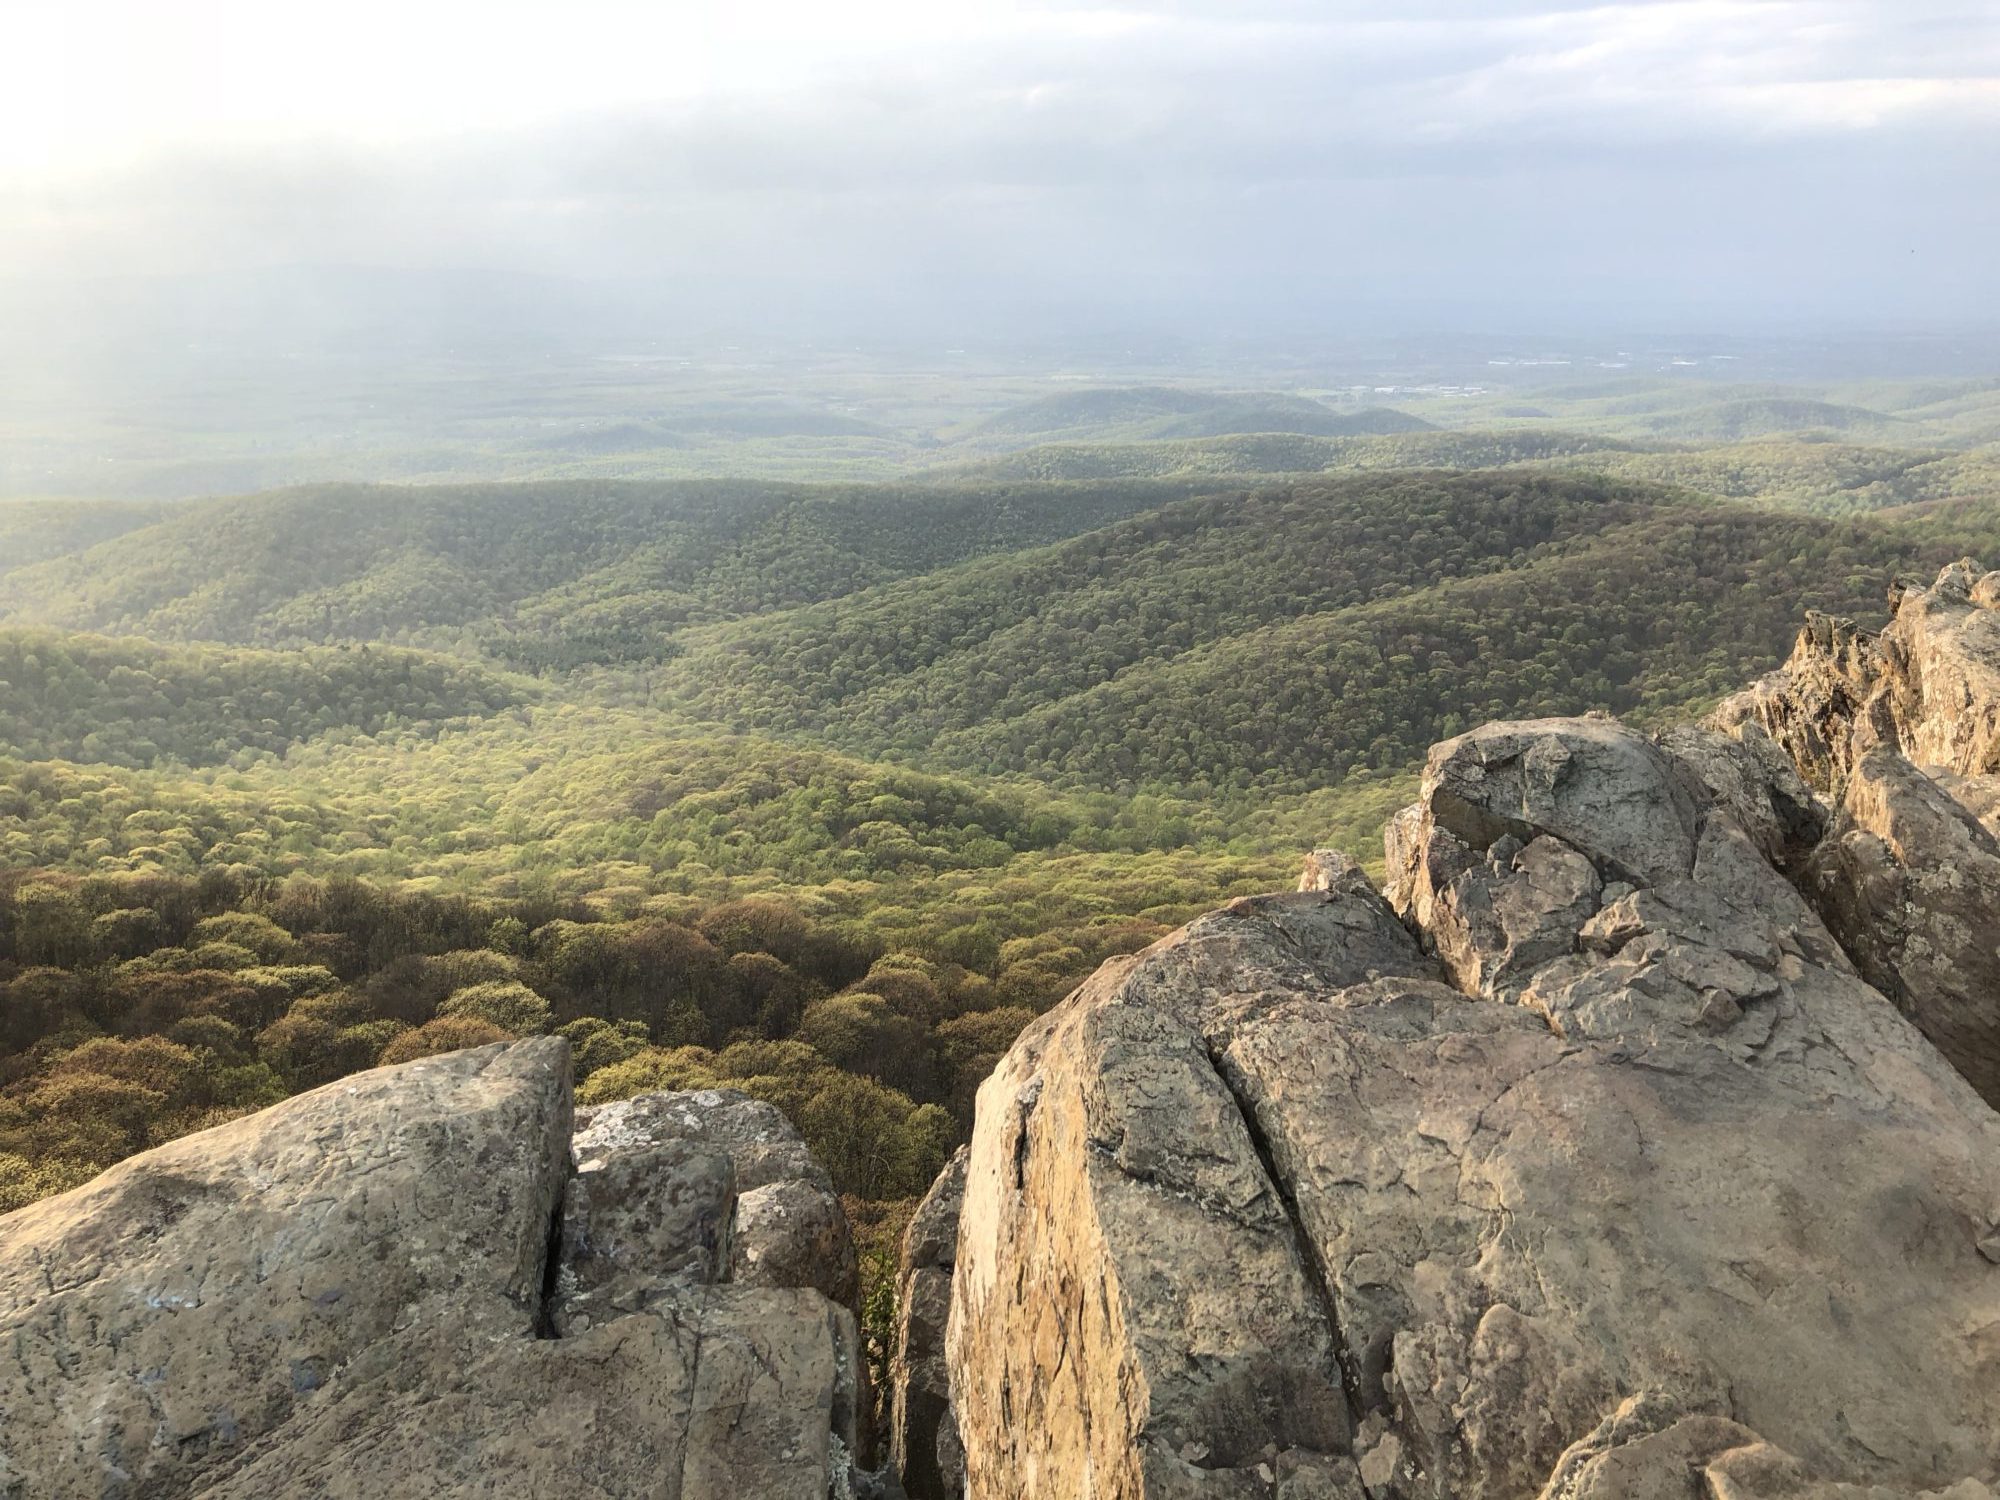
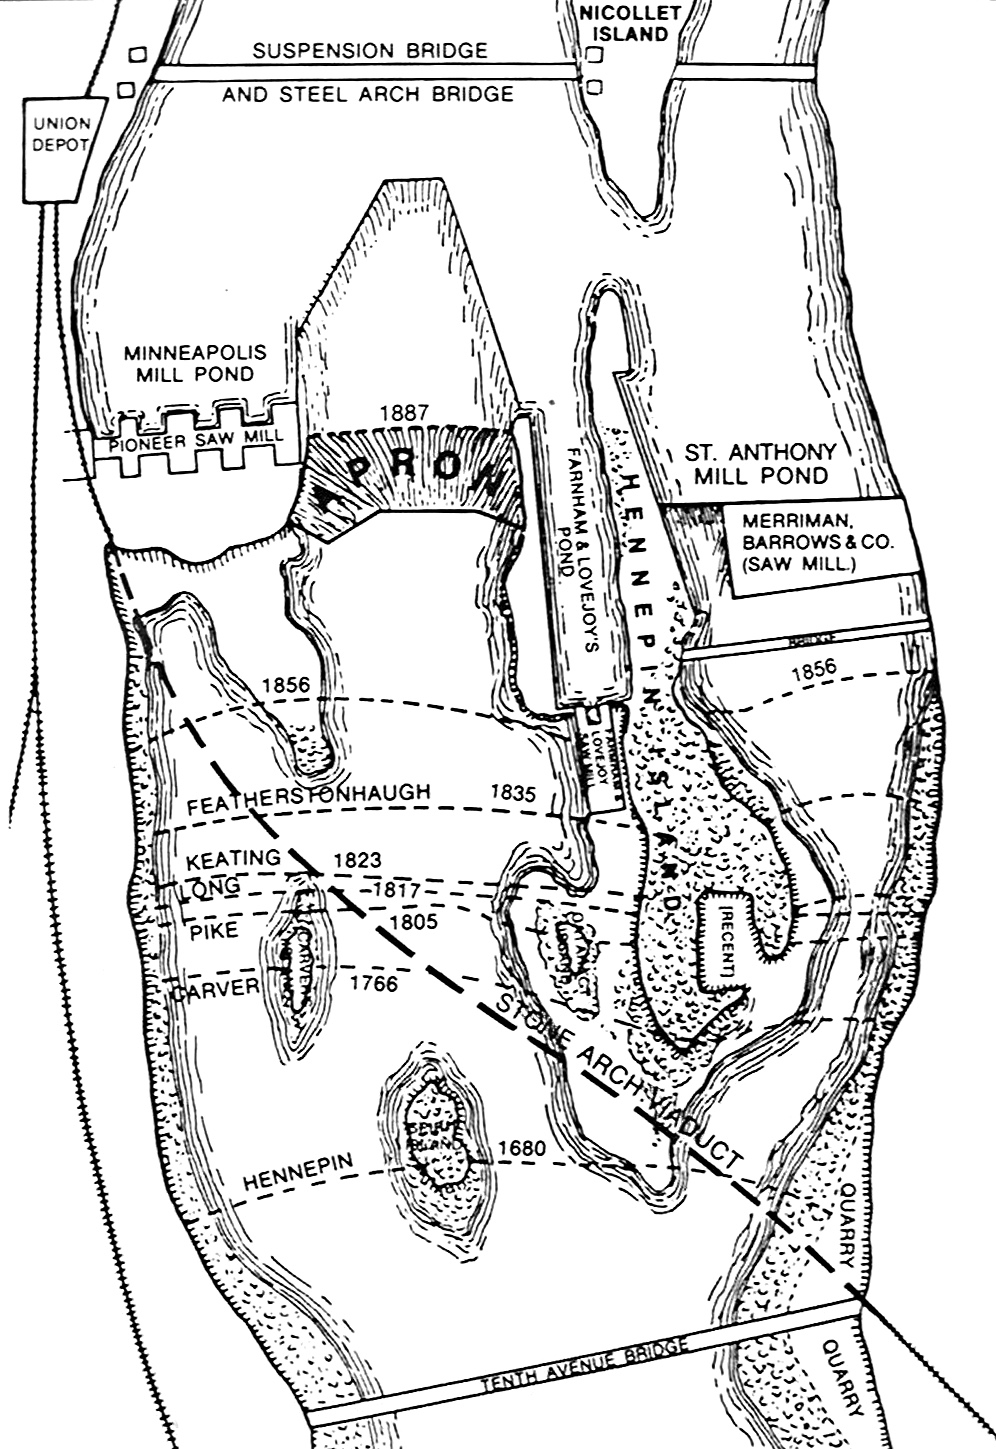
Of course, for many people the last year of learning did feel like eating dirt. I’m looking forward to innumerable things with the return to in-person life: leading students out to Virginia landscapes, sharing the beauty of a printed map, getting chalk dust all over my pants. But I hope to hold onto the things that shined a light for me through this dark year. In a time when our world has lost so much, I hope we gained the perspective to make the most of our opportunities to cultivate curiosity, while there’s still time.

A crisis by land, a revolution by sea

This month marks the anniversary of a seismic event that severed the lines of communication between the US and Europe.  This catastrophe revealed deep, powerful currents hidden beneath the surface, and changed our view of the landscape. But this not a story about American politics: it’s the story of the 1929 Grand Banks earthquake.

On November 18th of that year, a magnitude 7.2 earthquake struck offshore eastern Canada. The earthquake triggered a tsunami that caused heavy damage in Newfoundland and claimed 28 lives.

Several houses in Lord's Cove, Canada, displaced and toppled by the tsunami following the 1929 Grand Banks earthquake.
Houses toppled by the tsunami in Lord’s Cove, Canada. Image credit: H.M. Mosdell, W.M. Chisholm collection; Natural Resources Canada.

Though the link was obscured at the time, the catastrophe on land was caused by a dramatic upheaval on the ocean floor. The earthquake triggered an enormous submarine landslide, which generated the tsunami. A later study estimated the volume of the landslide at 200 cubic kilometers enough to fill a Texas-sized football stadium 10,000 times over! Beyond generating this staggering statistic, the events surrounding the Grand Banks earthquake transformed our understanding of the seafloor.

At the time of the earthquake, a network of transmission cables ran along the seafloor between North America and Europe. These cables originally conveyed the 19th century equivalent of a text message, and introduced the concept of a shared “now” between far-off places. Following the earthquake, 12 of these cables failed; some all at once, and others in a sequence moving roughly from north to south, with the furthest break more than 1000 km from the earthquake epicenter. Why did the second set of cables fail sequentially, and over such a long distance?

A bathymetric map of the seafloor offshore eastern Canada. A large gray area shows the extent of a key sedimentary deposit. The locations of transmission cable breaks are also shown.
Map of the seafloor offshore Newfoundland. Circles show the locations of cable breaks immediately following the earthquake (white) and those that broke sequentially thereafter (black). Reproduced from Piper et al. (1988), Figure 1.

The answer came in 1952, when researchers Bruce Heezen and Maurice Ewing argued that the submarine landslide initiated a current of sediment and water that raced across the seafloor and knocked out the cables. Reginald Daly had first proposed that these flows, known as turbidity currents, could occur in the ocean. Heezen and Ewing’s analysis revealed the cable breaks as the first direct evidence of a turbidity current. Later work by David Piper and colleagues used clues from the sediment deposit built by the flow to estimate its velocity. Imagine this: a billowing cloud of sediment moving as fast as a commuter train (60 to 100 km/hr), and as tall as a skyscraper (hundreds of meters).

An artist's rendition of a turbidity current: a dilute mixture of water and sediment moving across the seafloor.
An artist’s rendition of a turbidity current. Image credit: Open University and Wired Magazine.

At that time, more than a century of geologic thought had held firmly that the Earth evolved slowly and steadily. In the deep ocean, sediments were thought to pile up gradually and largely from the bodies of tiny creatures like diatoms, which fell to the seafloor like a “gentle rain from heaven.” A major shift in geologic thinking in the 20th century was that rare and catastrophic events, like the Grand Banks turbidity current, may write most of Earth’s history in sedimentary rock. The geologist Derek Ager wrote:

“In effect, in one step the concept of the turbidity current took us back to the catastrophism of earlier geological thought. In place of the comfortable doctrine of sedimentation keeping pace with subsidence, we were now faced with the notion of empty troughs forming in the sea-floor, with only occasional rushes of sediment to fill them.”

Sixty-five years after turbidity currents pushed to the forefront of seafloor research, the ocean still holds its secrets tightly. The sedimentary deposits built by these currents are the largest on Earth, and are the final resting place of bygone mountains. At St. Anthony Falls Laboratory, I am working with colleagues to shrink the flows and their deposits down to laboratory scale to observe their behavior over a matter of hours.

The transmission cables severed by the Grand Banks turbidity current were the key to building a shared present. Their destruction also transformed the way we think about the deep past. In opening lines of communication with our fellow inhabitants of Earth, we are sometimes lucky enough to listen in on the planet itself.

What can two ancient rifts in the American heartland tell us about our current divides?

Rifts are important to all epic stories. The story of the North American continent and its predecessors is no exception.

Episodically, forces from Earth’s interior started to stretch the crust apart, threatening to split the continents and open up a new ocean basins. Our first example, the Midcontinent Rift, started 1.1 billion years ago and eventually spanned an arc from modern-day Nebraska north to Minnesota, and back down to Michigan.

The map shows zones of low, medium, and high gravitational field strength across the central and eastern US. A distinct band of high gravitational field strength follows the Midcontinent Rift.
The Midcontinent Rift appears as an arc of high gravitational field strength from Kansas north to Minnesota and south again through Michigan (Map source: G. Randy Keller, U. Oklahoma).

Our second example, the Reelfoot Rift, began around 600 million years ago. It includes portions of modern Arkansas, Tennessee, Missouri, and Kentucky. “Successful” rifts eventually open up ocean basins, but neither the Mid-Continent Rift nor the Reelfoot Rift made it that far. Geologists are biased for action, so these “failed” rifts get a special name: aulacogens.

So what can we learn from these buried schisms from hundreds of millions of years ago?

The forces of separation may be inevitable, driven from deep within. Yet what fills the space of our separation has lasting consequences. In the case of the Midcontinent Rift, tectonic forces threatened to break the continent apart — but lavas helped to fill the gap. These lavas persist today, 1.1 billion years later, along the shores of Lake Superior. The waters circulating through the volcanic rock concentrated copper ore that has supported trade for thousands of years. Whereas weaker sedimentary rocks were scoured away, the stronger volcanic rocks stood up to attack from ice sheets. So despite being surrounded by one of the flattest regions in the US, those ancient rocks support  towering cliffs along Lake Superior. That lake, cradled by low land above the rift, stores a whopping ten percent of the global of fresh surface water supply.  


Cliffs on the shores of Lake Superior from the Minnesota shore.
Cliffs of volcanic rock along the shore of Lake Superior in Minnesota (Wikipedia).

On the other hand, the legacy of the Reelfoot Rift suggests a more ominous set of consequences for deep divisions. Take a look at this forecast of earthquake damage risk for 2017, produced by the US Geological Survey:

The map shows relatively higher risks of damaging earthquakes for broad swathes of California, but also Oklahoma and a smaller area including western Tennessee.
Map showing the forecast for a damaging earthquake for the continental United States in 2017 (US Geological Survey).

As you might expect, California has some of the most widespread elevated risk of a damaging earthquake, given its tangle of active faults. The elevated risks in Oklahoma and Kansas are a recent addition to this map due to induced earthquakes from hydraulic fracturing (aka “fracking”). But you’ll find another zone of surprisingly high earthquake risk in the east-central US, right in the neighborhood of the crust weakened by the Reelfoot Rift.

Some of the largest earthquakes ever to strike the continental US occurred in this same region. From December 1811 to February 1812, three enormous earthquakes struck near New Madrid, Missouri. Shifting ground beneath the Mississippi River threw it into instant turmoil, even causing the river to temporarily flow backwards by some accounts. Spouts of liquefied sand burst forth from the ground. Look around in Google Earth, and you might see the relict sand deposits lying on the surface.

The image shows a historic aerial photograph from Arkansas, US. The image shows farm fields on top of sedimentary deposits from the Mississippi River. The younger sand deposits triggered by earthquakes are brighter than their surroundings.
Deposits left over from eruptions of liquified sand are bright in this 1964 air photo from Arkansas . The sands sit atop older “point bar deposits” laid down by the Mississippi River  (US Geological Survey).

The region was sparsely populated at the time of the earthquakes, but now hosts 11 to 12 million people in the vicinity of Memphis and St. Louis. So could a similar earthquake sequence strike again? The available geologic evidence, largely from dating sand eruptions, indicates that similar events occurred in the past, at intervals separated by 200 to 800 years.

Just as cultural observers are digging to unearth the fault lines hidden beneath the surface of American society, geologists are searching for new clues about the rifts in the literal bedrock of America. Many citizens are disoriented by the suddenly uncertain contours of our society.

If there’s one way that geology can guide us, it’s this: the consequences of division can last long a lot longer than you might think. What will fill our political gaps: a society strengthened by renewed civic engagement, or one weakened by fake news? Either way, Earth history has its eyes on you.

What do you do when your waterfall is going extinct?

I spend most days in and around St. Anthony Falls, the largest waterfall on the Mississippi River. The sound of the falls rose to a crescendo in mid-Julyas each second over 30,000 cubic meters of water tumbled downward.

St. Anthony Falls on July 16, 2016.

When downtown Minneapolis turns quiet on a Sunday night, the waterfall roars on. So what if I told you this natural wonder is actually a museum piece?

The falls themselves were born roughly 10,000 years ago at the end of the last ice age. Starting then, water toppled huge blocks of limestone and quarried the sandstone beneath, causing the waterfall to move upstream at about one meter per year. The waterfall started beyond today’s downtown St. Paul. From 1680 to 1887 the falls actually moved about six city blocks, from near today’s SE 8th Ave. to SE 2nd Ave. (For more, see Thomas Hickson’s great vignette). Here’s a map of the falls’ position during that time:

Recorded positions of St. Anthony Falls in Minneapolis (credit: Univ. of Minnesota).

The Mill City was built around the St. Anthony Falls. But engineers discovered a problem that posed an existential threat to the falls. To understand why, let’s take a deeper look at the geology.

Underneath the city of Minneapolis, there are two layers of sedimentary rock that formed in a time when “Minnesota” was a shallow ocean. These layers are the St. Peter sandstone below and a younger Platteville limestone above. The limestone supports the lip of the falls. Engineers feared that once the falls eroded back to the edge of the limestone — which by the 1870s was a short distance upstream — the falls would crumble.

And so, amid this threat of geologic proportions, the Minneapolis Milling Company, and eventually the Army Corps of Engineers, intervened. They built a wooden “apron” to guide the flow over the falls and protect the underlying rock. By 1884, engineers had successfully halted the falls’ 10,000 year journey up the Mississippi River. The river, whose surface freezes in place every winter, found its rocky base frozen in place too.

An 1884 photo of the wooden apron built beneath St. Anthony Falls (credit: Univ. of Minnesota).

In the history of development and nature, the mummification of St. Anthony Falls is an unusual chapter. The falls would have likely gone extinct on their own, but people sought to grant them immortality through engineering. The cost was great. In some cases, accounts of the falls’ original majesty are inflated. But imagine a view even half as beautiful as this:

A pristine St. Anthony Falls as rendered by the painter Albert Bierstad (1830-1902) (credit: Wikipedia).

For better or for worse, the city was faced with economic calamity and took action. Minneapolitans in the 1870s ensured decades of hydroelectric and milling operations, and an enduring viewpoint for the city.

Strange as it may seem, there are interesting similarities and contrasts between the history of the falls and today’s major environmental challenges. Climate change poses a new and global set of risks, including flooding, heat waves, and shifting patterns of disease. And yet, the threats posed by the gradual rise in temperatures struggles to compete with the visceral power of an economy-sustaining waterfall on a countdown self-destruction. There are political reasons for our frustratingly slow response to climate change. But the biggest challenge to climate action arguably has nothing to do with politics. Instead, it is refining our senses to experience how the air we breathe is changing in ways we cannot see directly with our eyes.

For example, consider the work of scientists from the Scripps Institute of Oceanography that began in 1950s. Since then, generations of workers have collected measurements of carbon dioxide (CO2) from the isolated peak of Mauna Loa on the big island of Hawaii.  Here’s what the data look like, with the concentration of CO2 (in parts per million, or ppm) plotted against time:

The concentration of carbon dioxide from 1958 to present, measured at Mauna Loa, Hawaii (credit: Scripps Institute of Oceanography).

This dataset represents a breakthrough in awareness. Each year the curve cycles through a rise and fall, as plants borrow and return CO2 from the atmosphere. Over several years, we also see an overall upswing the concentration of the heat-trapping gas. Through decades of careful observation, we have amplified our senses. In a stroke of synesthesia, by looking at a graph we can see the Earth breathe.

The call to connect to something bigger than ourselves does not usually come from a laboratory notebook. But in the daily work of a geoscientist, there’s an almost spiritual mission: to reorient our perception beyond the confines of the human experience. To sense the breath of the planet as clearly as we hear the roar of the falls. If people can perceive climate change as clearly as they saw the falls moving toward trouble in the 19th century, the barriers to action might be more easily overcome. Taking measurements is a way to expand our senses.

Reading a valley, Part 2: How can you retrace a river’s footsteps?

For geoscientists, lacking direct experience is a common quandary (and it should be noted, a happy one!) One great workaround: the thought experiment. Back in 1909, the eminent geographer William Morris Davis used his powers of imagination to visualize how the Connecticut River might have carved its valley and left terraces. Here’s a beautiful sketch from his writings:

unnamed

River terraces in Massachusetts, from W. M. Davis’ Geographical Essays.

Davis surmised that the Connecticut River, migrating to and fro about its valley, left terraces as it gradually cut downward.  So was his guess plausible?

Nowadays Davis is better known for his ideas on whole-landscape evolution, decades before the plate tectonics revolution. In contrast, Davis’ hypothesis for “accidental” terrace formation popped up only now and then in the intervening decades and largely went untested. In the meantime, a different explanation gained popularity.

River terraces  — those remnant valley bottoms perched along river valleys all over the world — are eroded into old river sediments or bedrock, and are often interpreted as the signature of a river’s response to climate change.  The argument goes like this: if tectonic uplift pushes the landscape up at a steady rate, then a river steadily cuts downward to keep pace. In this quasi-equilibrium state, the river never pauses its downward carving. But if an outside force disturbs the river from equilibrium — for instance, by changing the supply of water and sediment–then the river may temporarily pause its downward journey before catching up with a rapid pulse of downcutting. Terrace surfaces would be eroded during the pauses, and the terraces would be stranded when the river cut downward.

Davis’ hypothesis is that rivers make terraces without pausing their downcutting, but instead by the unsteady lateral shifting of the river during downcutting. This distinction gets to the heart of reading the terrace record: if rivers in equilibrium also make terraces, then terraces may say nothing about regional changes in climate or tectonics. Instead, terraces would simply be the accidental remnants of wandering rivers.

So how might we distinguish between these competing arguments, given that most of the world’s terraces formed long before today?

One way is to see if the numbers add up: for example, how fast would a meandering river need to move in order to make an “accidental” terrace? To test this, my work unfolded in two steps. First, I translated Davis’ thought experiment to a simplified mathematical model, and then to computer code. With a flurry of for-loops and deluge of data structures, a Caltech supercomputer named for a turn-of-the century exploration ship tested hundreds of scenarios for valley evolution. Here’s a movie of the model in action:

A movie of valley evolution from our new paper in JGR-Earth Surface.

The top part shows a meandering river (in blue) flowing from left to right, viewed from above. Initially, the river buts up against bedrock walls: the topographic cross section in the lower part shows shows bedrock (black) and sediment (white), with the channel showing up as a narrow notch in the center of the cross section. As the clock zooms forward through 25,000 years, the meander bends migrate freely through the sediment and deform as they meet resistant bedrock. The uneven pattern of lateral erosion, coupled with vertical erosion, makes a set of terraces. The terraces are identified automatically during the simulation, and in the top section are colored according to their height above the channel. And just like that,107 years after Davis’ original hypothesis, we have new data to start testing it.

Based on these simulations, we built a predictive framework for what “accidental” terraces formed under steady climate should look like and how often they should form. In the second step of the analysis, I compared the model predictions to a selection of carefully studied valleys in the central and western US, including the Wind River valley from my last post. Here’s the summary figure:

fig16

Model predictions for terrace age and geometry and estimate erosion rates for natural river valleys from our new paper in JGR-Earth Surface.

For the geomorphologists: we found that key terrace attributes commonly attributed to climate change–such as the occurrence of pairs of terraces on either side of the valley, their length along the valley, and their separation in time by thousands of years–can form without climate change. These predictions hold for particular conditions: rivers must erode laterally relatively quickly (i.e., > 10 mm/yr) and cut down relatively slowly (i.e., < 1 mm/yr). By comparing to the natural river valleys, we see that the meandering river model with steady vertical incision explains key terrace attributes for the Colorado River valley (Texas) better than the Wind River valley.

Long story short: with an idea of how meandering rivers might make terraces under steady conditions, we have a better shot at identifying the terraces that really tell us something about climate change.

Particularly in the mountains, many of the flat surfaces you see are flat because a river used to run there. So give a glance around on your next trip through a river valley: you might be walking in the footsteps of the river itself. Terraces are a hot topic with lots of active research. For more new work on decoding the terrace record, see papers on the roles of landslides [Scherler et al., 2016], bedrock [Schanz and Montgomery, 2016], and climate change [Langston et al., 2015].

Reading a valley: Part 1

I had a new paper come out this month, entitled “Numerical model predictions of autogenic fluvial terraces and comparison to climate change expectations.” The paper and supplemental movies are up now at Journal of Geophysical Research – Earth Surface. This work developed from the last chapter of my thesis with my adviser and co-author Mike Lamb.  The question: how do we read geologic history from the shape of a river valley?

First, a little background. Most of us have some experience with rivers, which are hubs of human life worldwide. Close to home, the St. Anthony Falls on the Mississippi River were the nucleation point for the city of Minneapolis. The river has been central to the regional economy as an engine for flour mills and electricity, a highway for commercial shipping, and even the source of most of the world’s buttons. In nature, rivers also serve as hubs of activity for evolving landscapes. Rivers are conduits for the movement of sediment, water, and nutrients across continents to the ocean. In the life of a landscape, however, rivers are more than conveyor belts: rivers are also great integrators. Tectonics, climate, vegetation, and human disturbance all influence rivers, and rivers in turn shape the landscape around them. And lucky for us, the Earth’s surface and sediments hold a “fossil” record a river’s work over geologic time.

One of the most common remnants of a river’s activity is a river terrace. As its name implies, a river terrace is a flat area–in fact, it usually looks like a valley bottom. But there’s a twist: river terraces are former valley bottoms, abandoned so far above the active river that they are rarely (if ever) inundated in floods. Terraces often occur in a series of steps, and in an architectural mixed metaphor, a set of terrace steps that descend toward the modern river is called a “flight.” Here’s a spectacular flight of terraces from the Wind River valley, Wyoming from Hancock et al. [1999]: 

1-s2.0-S0169555X98000890-gr4
Terraces along the Wind River, Wyoming (Hancock et al. [1999], their Figure 4).
For another example, take a look at this classic Ansel Adams portrait:

“The Tetons and the Snake River” by Ansel Adams, 1942.

Between the Snake River in the foreground and the jagged Teton Mountains in the background, you’ll note several broad river terraces.

River terraces are usually subtle in profile, and hide in plain sight in river valleys across the globe. In some landscapes, terraces can be dated to hundreds of thousands of years old. These river terraces are some of the best available records of river response to environmental change. In fact, the most common explanation for why rivers abandon terraces in the first place is that climate change disturbs the balance of water and sediment delivered to the river, causing it to cut down further into its own valley. Thus, terraces hold key clues to climate in the past, and are vital to placing modern landscape change in context.

There’s a snag, however: rivers may make terraces of their own volition, without any changes in climate. Consider, for example, an experiment Les Hasbargen made here at St. Anthony Falls Lab in the late 1990s. In the experiment, a ~0.5 square meter patch of sediment served as the initial landscape, and was subjected to steady “rainfall” in the form of misted water droplets and steady “uplift” to build topography. A vivid landscape in microcosm burst into bloom, with famously shifting mountain ridgelines and yes, terraces. This sandbox-scale experiment showed that under simulated conditions with steady climate and tectonics, landscapes can develop features like river terraces that would otherwise seem to require climate change. Resolving terrace origin is difficult  using field observations alone, in part because river terraces are thought to form over millennial timescales.

So how can we reconstruct a valley’s history after arriving so late in the game? Stay tuned for Part 2.


What time is it in the world?

It’s hard to imagine, but simultaneity is a thoroughly modern concept. Before the telegraph, long-distance messages were carried exclusively by hand. The time delay built into all forms of communication ensured that what happened in the city one day would be a historical account by the time it made it to the countryside. By effectively eliminating the transit time of information, the telegraph transformed human conception of time and invented a “now” that could be experienced across a state, a country — and the world.

The story of the telegraph is one focus of The Information, James Gleick’s tour of information theory circa 2010. The book traces its subject historically, then concludes with Gleick’s assessment of our data-inundated times as patrons of The Library of Babel. We meet many fascinating characters along the way, including the quixotic encyclopedia writers who sought to transcribe every fact in the known world; Charles Babbage, the designer or a machine whose sprawling mass of gears and levers presaged the computer, a century before transistors; and Claude Shannon, whose theoretical work at Bell Laboratories is the foundation of modern digital life. Gleick amiably translates complicated source material, like quantum computing, in understandable and engaging terms. If the book drags anywhere, it’s in the extended history of the telegraph. But then I got to the invention of simultaneity.

Earth scientists are exceptionally curious about the things that predate the present. Yet our field is being similarly revolutionized by awareness of the planet’s activities in near real-time.

For decades seismometers have listened to the pulse of the planet, capturing local tremors and teleseismic calamities. Since the 1980s, the Landsat satellites have been capturing the mother of all home movies: a record of Earth surface change replete with meandering rivers, advancing dunes, surging glaciers, flowing lava, and shrinking lakes:

Lake Urmia, Iran

(Here are more jaw-dropping time lapse movies via Google Earth Engine).

The uniformitarian mantra “the present is the key to the past” may limit one’s geological imagination — look no further than T-Rex and the Crater of Doom. Yet paradoxically, that dusty old tenet of pre-plate tectonics geology may hold more power today than it ever has. Our worldview has literally expanded to a view of the whole world, and now even an armchair geoscience buff can see the present unfold just about anywhere on Earth’s surface.

Considering this embarrassment of riches, the challenge of sifting through the data to reach the information is a formidable task. The development of information theory in the 1940’s came just in time for Watson and Crick’s discovery of DNA, and informed the analysts who ultimately cracked the genetic code. Circa 2016, there’s never been a better time to crack the code of Earth’s surface.

In the beginning…

IMG_0997

“Welcome to the lithosphere!” – Jason Saleeby, greeting newly erupted lava in Hawaii, March 2013.

So I’m starting a blog.

Towards the end of my PhD I started a log of sorts to track my research–incremental steps, breakthroughs, dead ends–and to maintain a space for taking down half-formed ideas and sorting out alternatives when I hit a roadblock. Now, a year plus into a postdoc, the log is a sprawling jumble of largely mundane details and non sequiturs. I’m probably never reading most of that again. Nonetheless, taking some time to put ideas on the page has helped me keep my bearings and (hopefully) see some of the bigger picture.

With any luck this occasional project, a digital scrapbook for my adventures at the St. Anthony Falls Lab, will yield something of broader interest. Posts may flow out in voluminous sheets, quixotically striving to blanket the digital plains. More likely, new thoughts will surface sporadically in energetic blobs. Either way, you’ll find them here. And so, without further ado…
Welcome to the blogosphere.